
We recently had a requirement to perform some load testing on some new firewalls, time and cost were two main constraints along with some flexibility in using our own traffic profiles. After debating our options for a short time we settled on a new type of traffic generation tool, its open source, flexible, very cost effective, with no vendor / hardware lock-in…
Cisco Trex is an open source traffic generation toolset, comparable to tools such as IXIA, SPIRENT etc… It’s purpose is to overcome some challenges such as cost, scale, standardisation, and flexibility.
Trex Overview
With a flexible and powerfull traffic generation tool, we can;
- Test actual throughput rates and packet-per-second claims by vendor equipment
- Discover bottlenecks in production and test environments
- Perform accurate measurements of latency, jitter, and throughput
- Perform Penetration testing
- Perform Security and vulnerability testing, malformed packets, DoS
What differentiates Trex to other toolsets is its portability, cost, capacity and flexibility. The toolset is open source, and comes with the ability to communicate and receive instructions via RPC and Python API’s. The package is self contained and easily installed on various Linux distros. It also supports virtual interfaces, so can be installed and run on AWS, VirtualBox, ESXi, Fusion, or simply your laptop!
Throughput of up to 200Gbps have been tested with the right server hardware, this includes generating custom traffic profiles at L4-7 and the ability to analyse these flows in real-time for latency, packet loss, jitter and throughput.
Components of Trex
Hardware components
In its current state Trex supports x86 servers and Intel DPDK Network Interface Cards, the following Trex page outlines some recommendations and testing: Trex Manual
For detailed support requirements, NIC hardware, drivers and locations for software refer to the main Trex page Trex Home
Software components
OS requirements at this stage are Fedora 20 or higher, Ubuntu 14.04.1 or Ubuntu 16.04.1 or higher. However we have tested on CentOS and given you have the correct drivers this also works well.
Optional - Python for API access, and Scapy for packet creation (all these requirements and dependancies can be downloaded as part of the Trex Github) ‘trex-core’ branch at trex-core
Building and Running Trex with VirtualBox
This guide will setup a quick Trex environment and test on VirtualBox, so the entire test can be performed on a single laptop. The idea is to just provide a sample of what Trex can do and how flexible it really is.
- Download and build the Trex application on a VirtualBox VM
- Configure Trex for first test and use
- Configure a second Ubuntu VM as the DUT (Device Under Test)
- Explain the packet creating and YAML profile configuration process
- Run a throughout test and have the Ubuntu VM route the traffic (Linux IP forwarding)
- Analyse the output
Download and build the app
There are two options for running Trex on a VM;
- Download the packaged VirtualBox VM image, which includes Fedora_21 + Trex v1.63
- Create a VM running Fedora_21 and download Trex from the below location, then unpack-age The app is currently stored on a public repo @ http://trex-tgn.cisco.com/release/latest
$mkdir trex
$cd trex
$wget --no-cache http://trex-tgn.cisco.com/release/latest
$tar -xzvf latest
This will make a new directory with current version for example /v2.13
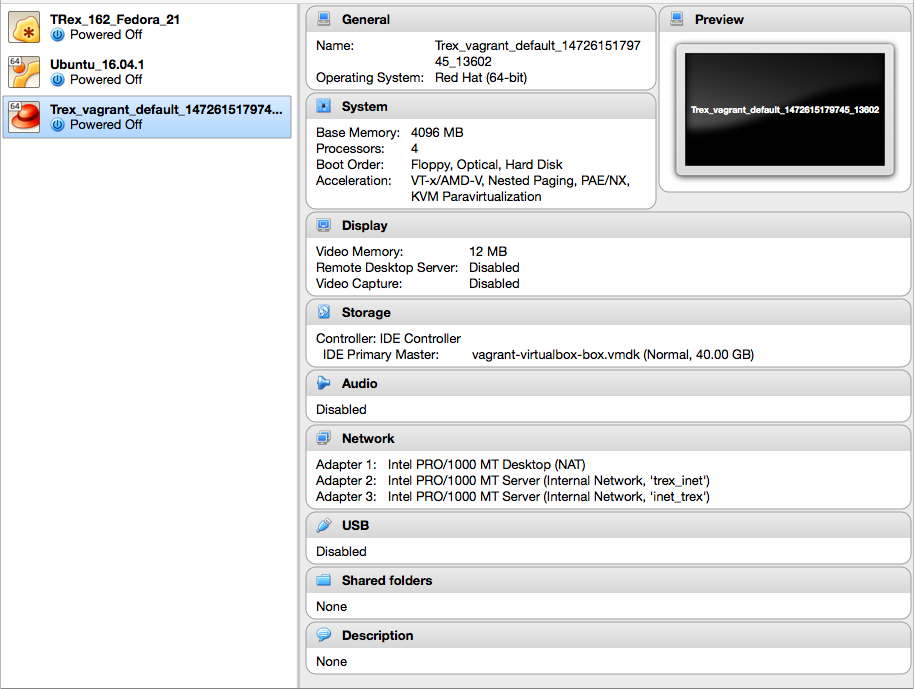
The recommendation would be to just download the VM image and then update / install the latest Trex version once the image is running. If you are building your own VM then the following are recommended resource configurations:
| Memory | CPU | Network |
|---|---|---|
| 4GB | 4vCPU | Adapter1 = NAT |
| Adapter2 = trex_intnet | ||
| Adapter3 = intnet |
Image below shows VB VM configuration:
Log onto the virtualmachine with the forwarded port, the VM setup will forward local port 3022 > 22 (ssh) on the VM
ssh -p 3022 trex@127.0.0.1
username: trex
password: trex
Change dir to latest version supplied using: cd /home/trex/v1.62/
Once the VM is built and running, ssh to it and confirm the interface status and bindings with sudo ./dpdk_setup_ports.py -s
[vagrant@localhost ~]$ ls
latest  netdata  trex
[vagrant@localhost ~]$ cd trex
[vagrant@localhost trex]$ ls
v2.08
[vagrant@localhost trex]$ cd v2.08/
[vagrant@localhost v2.08]$ ls
automation       daemon_server        external_libs     run_functional_tests  _t-rex-64-debug    trex-cfg
avl              doc_process.py       find_python.sh    run_regression        t-rex-64-debug     trex_client_v2.08.tar.gz
bp-sim-64        dpdk_nic_bind.py     ko                stl                   _t-rex-64-debug-o  trex-console
bp-sim-64-debug  dpdk_nic_bind.pyc    libzmq.so.3       stl-sim               t-rex-64-debug-o   trex_daemon_server
cap2             dpdk_setup_ports.py  master_daemon.py  _t-rex-64             _t-rex-64-o
cfg              exp                  python-lib        t-rex-64              t-rex-64-o
[vagrant@localhost v2.08]$ sudo ./dpdk_setup_ports.py  -s

Network devices using DPDK-compatible driver
============================================
<none>

Network devices using kernel driver
===================================
0000:00:03.0 '82540EM Gigabit Ethernet Controller' if=eth0 drv=e1000 unused=igb_uio,vfio-pci,uio_pci_generic *Active*
0000:00:08.0 '82545EM Gigabit Ethernet Controller (Copper)' if=eth1 drv=e1000 unused=igb_uio,vfio-pci,uio_pci_generic
0000:00:09.0 '82545EM Gigabit Ethernet Controller (Copper)' if=eth2 drv=e1000 unused=igb_uio,vfio-pci,uio_pci_generic

Other network devices
=====================
<none>
[vagrant@localhost v2.08]$
Trex minimum configuration
Trex utilises one main files for setup and configuration which are mandatory to reference each run, /etc/trex_cfg.yaml
You can copy a basic configuration file from cfg folder by running:
$cp cfg/simple_cfg.yaml /etc/trex_cfg.yaml
For this example we will have the following in our Trex_cfg.yaml file
- port_limit      : 2         # this option can limit the number of port of the platform
  version         : 2
  interfaces    : ["00:08.0","00:09.0"] #the interfaces using ./dpdk_setup_ports.py -s
  port_info       :  # set eh mac addr
          - dest_mac        :   [0x08,0x00,0x27,0x81,0x6d,0xe0]    # router mac addr should be taken from DUT
            src_mac         :   [0x08,0x00,0x27,0x8e,0xfc,0x42]  # source mac-addr - taken from ifconfig
          - dest_mac        :   [0x08,0x00,0x27,0x81,0xf6,0x63]  # router mac addr  taken from DUT
            src_mac         :   [0x08,0x00,0x27,0x23,0x21,0xdc]  #source mac-addr  taken from ifconfig
Configure the DUT (Ubuntu VM)
The DUT for this example will be a simple Ubuntu VM connected to the Trex VM via VirtualBox networking, the topology will be two interfaces on the DUT each of which are on a different VLAN connecting to the respective Trex VM VLAN. We will use basic Linux IP_Forwarding to have the traffic routed from one interface to the other, with a couple of static ARP and static routes. The topology is as follows…
Trex client-MAC01----trex-intnet-----MAC03-Ubuntu-enp0s8
Trex Server-MAC02-------intnet-------MAC04-Ubuntu-enp0s9
MAC01: [0x08,0x00,0x27,0x8e,0xfc,0x42]
MAC02: [0x08,0x00,0x27,0x23,0x21,0xdc]

MAC03: [0x08,0x00,0x27,0x81,0x6d,0xe0] IP: 192.168.1.100
MAC04: [0x08,0x00,0x27,0x81,0xf6,0x63] IP: 192.168.2.100
- Add two interfaces to the VirtualBox VM, each with adapter type of ‘server’
- Place each one in a separate VLAN [trex_intnet / intnet]
- Configure the interfaces with an IP on separate subnets
- Add the static routes for relevant pcap tests being run from Trex [eg; 16.0.0.0 and 48.0.0.0]. Route to dummy IP towards Trex
- Add the static ARP entires for next hop per interface to the dummy IP
Configure the interfaces with an IP on separate subnets
Add the static routes for relevant pcap tests being run from Trex [eg; 16.0.0.0 and 48.0.0.0]. Route to dummy IP towards Trex


source /etc/network/interfaces.d/*

# The loopback network interface
auto lo
iface lo inet loopback

# The primary network interface
auto enp0s3
iface enp0s3 inet dhcp

auto enp0s8
iface enp0s8 inet static
	address 192.168.1.100
	netmask 255.255.255.0
	network 192.168.1.0
	broadcast 192.168.1.255
	up route add -net 16.0.0.0 netmask 255.0.0.0 gw 192.168.1.101

auto enp0s9
iface enp0s9 inet static
    address 192.168.2.100
    netmask 255.255.255.0
	network 192.168.2.0
    broadcast 192.168.2.255
up route add -net 48.0.0.0 netmask 255.0.0.0 gw 192.168.2.101
Add the static ARP entires for next hop per interface to the dummy IP
aleks@ubuntu:/etc/network$ sudo arp -i enp0s8 -s 192.168.1.101 08:00:27:8e:fc:42
aleks@ubuntu:/etc/network$ sudo arp -i enp0s9 -s 192.168.2.101 08:00:27:23:21:dc

DUT@ubuntu:/etc/network$ arp
Address                  HWtype  HWaddress           Flags Mask            Iface
192.168.2.101            ether   08:00:27:23:21:dc   CM                    enp0s9
192.168.1.101            ether   08:00:27:8e:fc:42   CM                    enp0s8
10.0.2.2                 ether   52:54:00:12:35:02   C                     enp0s3

DUT@ubuntu:/etc/network$ route
Kernel IP routing table
Destination     Gateway         Genmask         Flags Metric Ref    Use Iface
default         10.0.2.2        0.0.0.0         UG    0      0        0 enp0s3
10.0.2.0        *               255.255.255.0   U     0      0        0 enp0s3
16.0.0.0        192.168.1.101   255.0.0.0       UG    0      0        0 enp0s8
48.0.0.0        192.168.2.101   255.0.0.0       UG    0      0        0 enp0s9
192.168.1.0     *               255.255.255.0   U     0      0        0 enp0s8
192.168.2.0     *               255.255.255.0   U     0      0        0 enp0s9
Thats it! We are ready to run our first test! For details on each component visist the trex guide mentioned above.
Running the first load test with Trex
The quickest way to begin a test is to just use one of the pre-defined .pcap files and yaml configuration files, these are all located under /trex/v2.08/cap2
[vagrant@localhost cap2]$ ls
asa_exploit.pcap              imix_fast_1g_100k_flows.yaml  rtsp_short1.yaml
asa_explot1.yaml              imix_fast_1g.yaml             rtsp_short2.yaml
citrix.pcap                   imix.yaml                     rtsp_short3.yaml
delay_10_rtp_250k_short.pcap  ipv4_vlan.yaml                rtsp_short.pcap
dns_no_delay.yaml             ipv6.pcap                     rtsp.yaml
dns_one_server.yaml           ipv6_vlan.yaml                sfr2.yaml
dns.pcap                      ipv6.yaml                     sfr3.yaml
dns_single_server.yaml        jumbo.pcap                    sfr4.yaml
dns_wlen1.yaml                jumbo.yaml                    sfr_agg_tcp14_udp11_http200msec_new_high_new_nir_profile_ipg_mix.yaml
dns_wlen2.yaml                lb_ex1.yaml                   sfr_agg_tcp14_udp11_http200msec_new_high_new_nir_profile.yaml
dns_wlength.yaml              limit_multi_pkt.yaml          sfr.yaml
dns_wlen.yaml                 limit_single_pkt.yaml         short_tcp.yaml
dns.yaml                      mail_pop.pcap                 sip_short1.yaml
dyn_pyld1.yaml                many_client_example.yaml      sip_short2.yaml
exchange.pcap                 nat_test.yaml                 smtp.pcap
http_browsing.pcap            Oracle.pcap                   test_mac.yaml
http_get.pcap                 per_template_gen1.yaml        test_pcap_mode1.yaml
http_plugin.yaml              per_template_gen2.yaml        test_pcap_mode2.yaml
http_post.pcap                per_template_gen3.yaml        tuple_gen.yaml
http_simple.yaml              per_template_gen4.yaml        udp_1518B.pcap
https.pcap                    per_template_gen5.yaml        udp_594B.pcap
http_very_long.yaml           rtp_160k.pcap                 udp_64B.pcap
http.yaml                     rtp_250k_rtp_only_1.pcap      Video_Calls.pcap
imix_1518.yaml                rtp_250k_rtp_only_2.pcap      Voice_calls_rtp_only.pcap
imix_64_100k.yaml             rtp_250k_rtp_only.pcap        wrong_ip.pcap
imix_64.yaml                  rtsp_full1.yaml               wrong_ip.yaml
imix_9k_burst_10.yaml         rtsp_full2.yaml
imix_9k.yaml                  rtsp_short1_slow.yaml
We will use the http_simple for our test which consists of one .pcap files containing a HTTP session, IP range for clients from 16.0.0.1 to 16.0.0.255
- duration : 0.1
  generator :
          distribution : "seq"
          clients_start : "16.0.0.1"
          clients_end   : "16.0.0.255"
          servers_start : "48.0.0.1"
          servers_end   : "48.0.255.255"
          clients_per_gb : 201
          min_clients    : 101
          dual_port_mask : "1.0.0.0"
          tcp_aging      : 0
          udp_aging      : 0
  mac        : [0x0,0x0,0x0,0x1,0x0,0x00]
  cap_ipg    : true
  cap_info :
     - name: avl/delay_10_http_browsing_0.pcap
       cps : 2.776
       ipg : 10000
       rtt : 10000
       w   : 1
To begin the test and monitor this live on the trex server we just run one simple command with a few parameters
sudo ./t-rex-64 -f cap2/http_simple.yaml -d 100 -m 1 --nc
-f is the source yaml file to be used for the test
-d Duration of the test in seconds (minimum is 30)
-m Factor for bandwidth (multiply the CPS of each template in the .yaml file by this number)
--nc If set, will terminate exacly at the end of the duration. This provides a faster, more accurate TRex termination. In default it wait for all the flow to terminate gracefully. In case of a very long flow the termination might be prolong.
-l Run the latency daemon in this Hz rate. Example: -l 1000 runs 1000 pkt/sec from each interface. A value of zero (0) disables the latency check.
-c Number of cores per dual interface. Use 4 for TRex 40Gb/sec. Monitor the CPU% of TRex - it should be ~50%.
TRex uses 2 cores for inner needs, the rest of cores can be used divided by number of dual interfaces.
For virtual NICs the limit is -c=1.
Once we begin the test we should see the following output
[vagrant@localhost v2.08]$ sudo ./t-rex-64 -f cap2/http_simple.yaml -d 30 -l 1000 -m 40 --nc
Loading kernel drivers for the first time
/usr/bin/python dpdk_nic_bind.py --bind=igb_uio 0000:00:08.0
/usr/bin/python dpdk_nic_bind.py --bind=igb_uio 0000:00:09.0

Starting  TRex v2.08 please wait  ...
found configuration file at /etc/trex_cfg.yaml
no client generator pool configured, using default pool
no server generator pool configured, using default pool
zmq publisher at: tcp://*:4500
 Number of ports found: 2
 set driver name rte_em_pmd
 wait 1 sec .
port : 0
------------
link         :  link : Link Up - speed 1000 Mbps - full-duplex
promiscuous  : 0
port : 1
------------
link         :  link : Link Up - speed 1000 Mbps - full-duplex
promiscuous  : 0
 -------------------------------
 core, c-port, c-queue, s-port, s-queue, lat-queue
 ------------------------------------------
 1        0      0       1       0      0
 -------------------------------
 number of ports         : 2
 max cores for 2 ports   : 1
 max queue per port      : 1
no client generator pool configured, using default pool
no server generator pool configured, using default pool
 -- loading cap file avl/delay_10_http_browsing_0.pcap
 Generating erf file ...


-Per port stats table
      ports |               0 |               1
 -----------------------------------------------------------------------------------------
   opackets |            1082 |            1422
     obytes |           77182 |         1296676
   ipackets |            1422 |            1082
     ibytes |         1296676 |           77182
    ierrors |               0 |               0
    oerrors |               0 |               0
      Tx Bw |       0.00  bps |       0.00  bps

-Global stats enabled
 Cpu Utilization : 0.0  %  0.0 Gb/core
 Platform_factor : 1.0
 Total-Tx        :       0.00  bps
 Total-Rx        :       0.00  bps
 Total-PPS       :       0.00  pps
 Total-CPS       :       0.00  cps

 Expected-PPS    :       4.11 Kpps
 Expected-CPS    :     111.04  cps
 Expected-BPS    :      30.58 Mbps

 Active-flows    :       15  Clients :      255   Socket-util : 0.0001 %
 Open-flows      :       48  Servers :    65535   Socket :       15 Socket/Clients :  0.1
 drop-rate       :       0.00  bps
 current time    : 1.7 sec
 test duration   : 28.3 sec

-Latency stats enabled
 Cpu Utilization : 0.0 %
 if|   tx_ok , rx_ok  , rx check ,error,       latency (usec) ,    Jitter          max window
   |         ,        ,          ,     ,   average   ,   max  ,    (usec)
 ----------------------------------------------------------------------------------------------------------------
 0 |      545,     543,         0,    0,       1045  ,    6552,      60      |  0  0  0  0  0  0  0  0  0  0  0  0  0
 1 |      545,     543,         0,    0,       1002  ,    6064,      53      |  0  0  0  0  0  0  0  0  0  0  0  0  0
Trex will provide sampled output every seconds which displays throughput, latency, drop rate, connections, window, CPU utilisation
-Per port stats table
      ports |               0 |               1
 -----------------------------------------------------------------------------------------
   opackets |           17783 |           24646
     obytes |         1268505 |        25882924
   ipackets |           24646 |           17783
     ibytes |        25882924 |         1268505
    ierrors |               0 |               0
    oerrors |               0 |               0
      Tx Bw |       1.44 Mbps |      29.67 Mbps

-Global stats enabled
 Cpu Utilization : 2.2  %  2.8 Gb/core
 Platform_factor : 1.0
 Total-Tx        :      31.10 Mbps
 Total-Rx        :      31.10 Mbps
 Total-PPS       :       6.02 Kpps
 Total-CPS       :     109.21  cps

 Expected-PPS    :       4.11 Kpps
 Expected-CPS    :     111.04  cps
 Expected-BPS    :      30.58 Mbps

 Active-flows    :       14  Clients :      255   Socket-util : 0.0001 %
 Open-flows      :      773  Servers :    65535   Socket :       14 Socket/Clients :  0.1
 drop-rate       :       0.00  bps
 current time    : 8.3 sec
 test duration   : 21.7 sec

-Latency stats enabled
 Cpu Utilization : 0.3 %
 if|   tx_ok , rx_ok  , rx check ,error,       latency (usec) ,    Jitter          max window
   |         ,        ,          ,     ,   average   ,   max  ,    (usec)
 ----------------------------------------------------------------------------------------------------------------
 0 |     7086,    7085,         0,    0,       1012  ,    6552,      14      |  0  6552  1261  2611  1106  1458  1102  1272  1348  1377  1139  1215  1104
 1 |     7086,    7085,         0,    0,       1024  ,    6064,      13      |  0  6064  1270  2647  1121  1502  1110  1286  1361  1404  1150  1222  1117
To confirm the test is working we should see RX and TX packets incrementing, drop rate might increment if the DUT cannot handle the load. Latency is measured in (uSec) While the test is running we can confirm the DUT (in our case Ubuntu VM) is receiving and forwarding the traffic with just ‘ifconfig’ and determine the RX / TX is increasing for each run
enp0s3    Link encap:Ethernet  HWaddr 08:00:27:36:e0:85
          inet addr:10.0.2.15  Bcast:10.0.2.255  Mask:255.255.255.0
          inet6 addr: fe80::a00:27ff:fe36:e085/64 Scope:Link
          UP BROADCAST RUNNING MULTICAST  MTU:1500  Metric:1
          RX packets:1269 errors:0 dropped:0 overruns:0 frame:0
          TX packets:1211 errors:0 dropped:0 overruns:0 carrier:0
          collisions:0 txqueuelen:1000
          RX bytes:169359 (169.3 KB)  TX bytes:132289 (132.2 KB)

enp0s8    Link encap:Ethernet  HWaddr 08:00:27:81:6d:e0
          inet addr:192.168.1.100  Bcast:192.168.1.255  Mask:255.255.255.0
          inet6 addr: fe80::a00:27ff:fe81:6de0/64 Scope:Link
          UP BROADCAST RUNNING MULTICAST  MTU:1500  Metric:1
          RX packets:69827 errors:0 dropped:0 overruns:0 frame:0
          TX packets:97056 errors:0 dropped:0 overruns:0 carrier:0
          collisions:0 txqueuelen:1000
          RX bytes:4981561 (4.9 MB)  TX bytes:102567940 (102.5 MB)

enp0s9    Link encap:Ethernet  HWaddr 08:00:27:81:f6:63
          inet addr:192.168.2.100  Bcast:192.168.2.255  Mask:255.255.255.0
          inet6 addr: fe80::a00:27ff:fe81:f663/64 Scope:Link
          UP BROADCAST RUNNING MULTICAST  MTU:1500  Metric:1
          RX packets:97048 errors:0 dropped:0 overruns:0 frame:0
          TX packets:69835 errors:0 dropped:0 overruns:0 carrier:0
          collisions:0 txqueuelen:1000
          RX bytes:102567292 (102.5 MB)  TX bytes:4982209 (4.9 MB)

lo        Link encap:Local Loopback
          inet addr:127.0.0.1  Mask:255.0.0.0
          inet6 addr: ::1/128 Scope:Host
          UP LOOPBACK RUNNING  MTU:65536  Metric:1
          RX packets:260 errors:0 dropped:0 overruns:0 frame:0
          TX packets:260 errors:0 dropped:0 overruns:0 carrier:0
          collisions:0 txqueuelen:1
          RX bytes:17760 (17.7 KB)  TX bytes:17760 (17.7 KB)
Check again
enp0s3    Link encap:Ethernet  HWaddr 08:00:27:36:e0:85
          inet addr:10.0.2.15  Bcast:10.0.2.255  Mask:255.255.255.0
          inet6 addr: fe80::a00:27ff:fe36:e085/64 Scope:Link
          UP BROADCAST RUNNING MULTICAST  MTU:1500  Metric:1
          RX packets:1277 errors:0 dropped:0 overruns:0 frame:0
          TX packets:1217 errors:0 dropped:0 overruns:0 carrier:0
          collisions:0 txqueuelen:1000
          RX bytes:170007 (170.0 KB)  TX bytes:139621 (139.6 KB)

enp0s8    Link encap:Ethernet  HWaddr 08:00:27:81:6d:e0
          inet addr:192.168.1.100  Bcast:192.168.1.255  Mask:255.255.255.0
          inet6 addr: fe80::a00:27ff:fe81:6de0/64 Scope:Link
          UP BROADCAST RUNNING MULTICAST  MTU:1500  Metric:1
          RX packets:73720 errors:0 dropped:0 overruns:0 frame:0
          TX packets:102471 errors:0 dropped:0 overruns:0 carrier:0
          collisions:0 txqueuelen:1000
          RX bytes:5259266 (5.2 MB)  TX bytes:108296022 (108.2 MB)

enp0s9    Link encap:Ethernet  HWaddr 08:00:27:81:f6:63
          inet addr:192.168.2.100  Bcast:192.168.2.255  Mask:255.255.255.0
          inet6 addr: fe80::a00:27ff:fe81:f663/64 Scope:Link
          UP BROADCAST RUNNING MULTICAST  MTU:1500  Metric:1
          RX packets:102463 errors:0 dropped:0 overruns:0 frame:0
          TX packets:73728 errors:0 dropped:0 overruns:0 carrier:0
          collisions:0 txqueuelen:1000
          RX bytes:108295374 (108.2 MB)  TX bytes:5259914 (5.2 MB)

lo        Link encap:Local Loopback
          inet addr:127.0.0.1  Mask:255.0.0.0
          inet6 addr: ::1/128 Scope:Host
          UP LOOPBACK RUNNING  MTU:65536  Metric:1
          RX packets:260 errors:0 dropped:0 overruns:0 frame:0
          TX packets:260 errors:0 dropped:0 overruns:0 carrier:0
          collisions:0 txqueuelen:1
          RX bytes:17760 (17.7 KB)  TX bytes:17760 (17.7 KB)
For a basic introduction and test run this is sufficient to get an understanding of what Trex can do, this tutorial is extremely limited and does not articulate the true power and flexibility of Trex. We will provide more updates to this about Scapy, RPC and Python API, interactive client and more soon. In the meantime for more detail on Trex and configuration, guides etc the following resources are a good start: